Last Updated: April 2026
Kubernetes Cost Management
The Complete Guide to Container Cost Optimization in 2026
START OPTIMIZINGSummary
Kubernetes cost management = Tracking + Allocation + Optimization of container costs across clusters. It answers: Where is the money going? Who owns the cost? How do we cut waste without breaking performance? Teams that adopt it cut container waste by 30–50%.
Kubernetes is not expensive. Misconfigured Kubernetes is. That distinction is the single most important thing to understand about container cost management. We have analyzed hundreds of Kubernetes environments across AWS, Azure, and GCP, and the pattern is always the same: teams overprovision by 40-60%, realize it six months too late, and then scramble to fix what should have been prevented.
In most Kubernetes environments we analyze, 30-50% of cost is wasted before teams even realize it. The problem is not containers. It is that traditional cloud cost tools were built for static VMs, not ephemeral pods. They scan hourly, miss workloads that live for minutes, and cannot map pod-level consumption to node-level billing.
This guide is not a blog post. It is an operational reference. Whether you are a DevOps engineer, a FinOps practitioner, or a platform team lead, you will find frameworks, formulas, and decision models here, not just explanations. Everything is grounded in patterns we have seen across real cloud cost management engagements.
At a Glance
Key Entity Definitions
| Kubernetes | Open-source container orchestration platform that automates deployment, scaling, and management of containerized applications |
| FinOps | Cloud financial management discipline that brings financial accountability to cloud spending through collaboration between engineering, finance, and business teams. |
| AWS EKS | Managed Kubernetes service by Amazon Web Services. Charges a per-cluster management fee ($0.10/hr) plus underlying EC2 or Fargate costs. |
| Azure AKS | Managed Kubernetes service by Microsoft Azure. No control plane fee on the standard tier; costs come from VMs, disks, and load balancers |
| GCP GKE | Managed Kubernetes service by Google Cloud. Charges management fees for both Autopilot and Standard tiers; Autopilot provisions per pod. |
What Is Kubernetes Cost Management?
If you cannot tell your CFO exactly how much your checkout service costs per month, you do not have Kubernetes cost management. You have billing data. That is the gap most teams fall into. They have dashboards, metrics, and alerts, but they cannot connect infrastructure spend to business outcomes.
Unlike traditional VM cost tracking, Kubernetes introduces a shared resource model where multiple workloads run on the same nodes. A structured approach, grounded in FinOps best practices and supported by dedicated FinOps tools, is essential. Without it, cost management is guesswork dressed up as a dashboard.
Kubernetes cost management answers three questions: Where is the money going? Who is responsible for that spend? And how do we reduce waste without breaking anything?

Why Is Kubernetes Cost Management Important in 2026?
The mistake we see most often: teams treat Kubernetes cost management as a finance problem. It is not. It is an engineering problem with financial consequences. When developers set CPU requests based on worst-case scenarios and never revisit them, the waste is baked into every deployment. That waste compounds. Understanding why cloud costs spiral is the first step toward preventing it.
These are the warning signs your cloud cost strategy is failing. Organizations that invest early in visibility, allocation, and optimization build a lasting advantage. Those that wait end up playing catch-up against a bill that compounds faster than they can track. For a broader view on this shift, read how cloud spend is becoming cloud strategy.
When Should You Invest in Kubernetes Cost Management?
Not every organization needs the same level of investment. The mistake we see is either ignoring costs entirely or over-engineering the solution for a small cluster. Here is the decision framework we recommend:
| Annual K8s Spend | Recommended Investment | Expected ROI |
|---|---|---|
| Under $50K | Basic monitoring. Track namespace costs. No dedicated tooling needed. | Awareness. Prevents surprise bills. |
| $50K - $500K | Invest in visibility + allocation. Implement tagging. Right-size top 20 workloads. | 15-25% cost reduction. $10K-$125K saved. |
| $500K - $2M | Full FinOps practice. Dedicated tools. Governance policies. Automation. | 25-40% reduction. $125K-$800K saved. |
| $2M+ | Embedded FinOps team. AI-driven optimization. Unit economics tracking. | 30-50% reduction. $600K-$1M+ saved. |
If you are not actively managing Kubernetes costs above $100K annual spend, you are overspending. Period. That is not a sales pitch. It is a mathematical certainty given the overprovisioning rates we see in every environment. Our guide on building FinOps at scale helps teams structure their practice at the right maturity level.
What Is Kubernetes Cost Monitoring?
Most teams monitor performance. Very few monitor cost. That is the gap. Your Grafana dashboards show CPU utilization. They do not show that your staging namespace is costing $8,000/month for workloads nobody has touched in three months. Our Kubernetes monitoring guide covers the essential metrics and tooling in depth.
Effective monitoring requires both infrastructure metrics and financial data. Tools like Prometheus and Grafana handle the metrics. Platforms like Opslyft layer in real-time cost data to bridge the gap. For teams exploring cloud financial planning, connecting monitoring data to budgeting tools is the natural next step.
The transition from monitoring to management is where most teams stumble. Collecting data is the easy part. Turning that data into decisions that actually reduce spend requires connecting metrics to dollars, and dollars to the teams that drive them. If a dashboard does not prompt someone to change something, it is decoration.
How Does Kubernetes Pricing Work Across AWS, Azure, and GCP?
The pricing model you choose determines 40–60% of your total Kubernetes cost. On-demand vs reserved, standard vs spot, managed vs self-managed. These decisions cascade through every cluster. For a full comparison, see our AWS vs Azure vs GCP breakdown.
Why Are Kubernetes Costs So Hard to Manage?
In real environments, the problem is never one thing. It is resource requests set to worst-case, combined with shared nodes nobody owns, combined with pods that live for 30 seconds, combined with 15 clusters nobody centrally manages. Understanding Kubernetes node vs pod vs cluster hierarchy is the starting point.
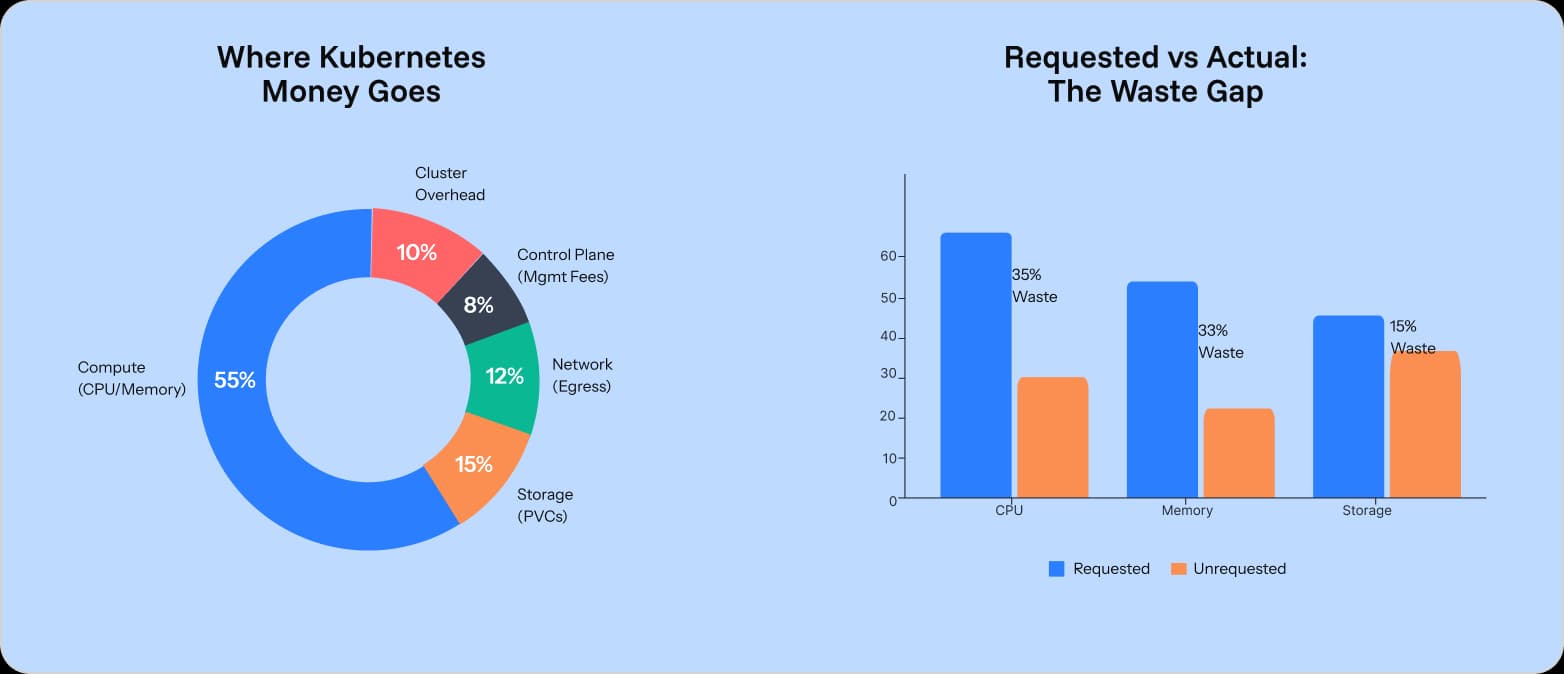
Waste = Requested Resources – Actual Usage. In the average cluster: Requested = 60% of node capacity. Actual = 25% of node capacity. Waste = 35% of every dollar spent. On a $1M K8s bill, that is $350K burned.
Most Kubernetes waste comes from overestimated CPU requests, not unused nodes. That distinction matters because it points to a fixable engineering habit, not a structural problem.
Shared Infrastructure
Multiple teams share the same nodes. Without allocation tools, nobody owns the bill. This creates finger-pointing during cost reviews. This is why helping engineers understand cloud costs is not optional. It is foundational.
Ephemeral Workloads
Pods are created and destroyed constantly. Traditional billing tools miss the granularity needed. Our analysis of hidden Kubernetes cloud costs explores these blind spots.
Multi-Cluster Sprawl
What starts as three clusters grows into thirty across three clouds. Each has its own billing quirks. Our guide on cloud cost elasticity explains how infrastructure sprawl creates or destroys value.
If your Kubernetes spend is growing faster than your workload count, you already have a cost leak. Most teams discover this too late. Costs compound monthly.
Curious Where Your Kubernetes Spend Is Leaking?
What Are the Core Components of a Kubernetes Cost Strategy?
1. Cost Visibility
If you cannot see it, you cannot fix it. Visibility means real-time, granular insight into what every cluster, namespace, and pod is costing. Build CFO dashboards and KPIs that translate container metrics into business-level insights. Understand what cloud optimization actually involves before jumping to tools.
2. Cost Allocation
Allocation assigns every dollar to the team that consumed it. This requires labels, annotations, and namespace mapping. Follow FinOps cost allocation best practices and enforce a consistent tagging strategy. Without allocation, optimization is a budget discussion with no owners.
3. Cost Optimization
Right-size requests. Use spot instances. Autoscale intelligently. Clean up idle resources. Our Kubernetes cost optimization guide provides the full playbook. For non-Kubernetes strategies, our cloud cost optimization guide covers the broader landscape.
4. Cost Governance
Governance prevents waste from returning. Namespace quotas, LimitRanges, budget alerts, approval workflows. Connect to cloud budgeting, forecasting steps , and technology spend management.
How Do You Apply Kubernetes Cost Management in Practice?
Theory is useful, but execution is what saves money. Here is the five-step framework we use with every team, whether they manage three clusters or thirty.
- Track cost per namespace and workload. Connect billing APIs to K8s metadata so every dollar maps to an owner.
- Right-size CPU and memory requests. Analyze 7–14 days of utilization. Set requests to the 95th percentile of actual usage.
- Enable cluster autoscaling. Remove underutilized nodes. Add capacity only when pods are pending.
- Allocate costs using labels and tags. Enforce a consistent policy across every cluster.
- Monitor anomalies in real time. Catch spikes in hours, not at month-end.
Teams that follow this consistently report 25–45% reductions in container waste within six months. For a broader look at building this muscle, read our guide on how to optimize cloud usage.
What Are the Key Kubernetes Cost Formulas?
Mental models make costs sticky. If your team cannot express the cost problem in a formula, they will not fix it consistently. Here are the three formulas we teach:
These formulas are shareable, citable, and actionable. Pin them in your Slack channel. Print them on the wall. They are the foundation of cloud TCO analysis.
Which Metrics Matter Most for Kubernetes Cost Monitoring?
- Compute utilization: CPU and memory usage versus requests and limits.
- Storage consumption: Persistent volume claims and actual usage patterns.
- Network costs: Inter-zone, inter-region, and egress traffic charges.
- Cluster overhead: System pods, kube-system namespace, and control plane costs.
For AWS teams, combining AWS Cost Optimization Hub with K8s metrics provides the most complete picture. Track the right FinOps KPIs to ensure dashboards lead to action. AWS's new cost efficiency metric provides a useful baseline.
What Are the Best Kubernetes Cost Optimization Strategies?
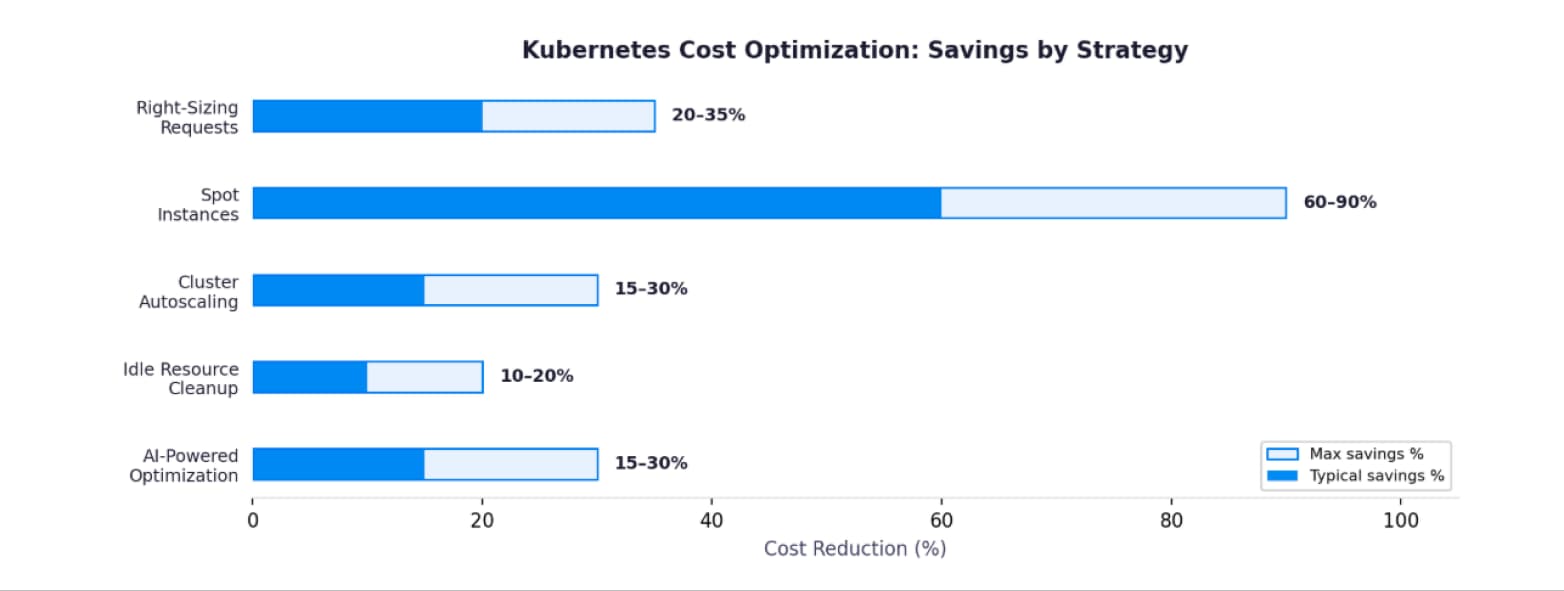
Right-Sizing Resource Requests and Limits
This is the single highest-impact optimization. Analyze 7-14 days of utilization data. Set requests to the 95th percentile. Teams recover 20-35% of compute spend every time. It is not glamorous, but it consistently delivers the biggest savings.
Leveraging Spot and Preemptible Instances
Spot instances reduce node costs by 60-90% for fault-tolerant workloads. Our proven strategies for cost control covers implementation. For AWS specifics, see AWS Auto Scaling.
Cluster Autoscaling
Autoscaling is not set-and-forget. Tune scale-down thresholds based on workload patterns. Understanding cloud scalability and cloud elasticity helps frame the right approach.
Idle Resource Cleanup
Orphaned volumes, forgotten dev namespaces, zombie deployments. Our practical guide to reducing cloud waste eliminates these hidden drains. In our experience, idle resources account for 10-20% of total K8s spend.
AI-Powered Optimization
ML models that continuously right-size catch drift that manual reviews miss. Compare approaches in AI vs manual optimization and our AI cost optimization guide.
What Are the Fastest Ways to Reduce Kubernetes Costs?
Quick Wins (Implement This Week)
- Shut down non-production clusters outside business hours. Saves 65% on dev and staging.
- Consolidate small clusters into shared platforms. Eliminates per-cluster overhead.
- Switch from on-demand to committed use discounts for predictable base workloads.
Before committing to any tool, review our 10 questions to ask before choosing a cloud optimizer.
Long-Term Plays (Build Over Time)
Adopt cost-aware architecture from day one. Implement infrastructure as code with cost guardrails. Embed cost checks into CI/CD pipelines following CI/CD best practices. These create a culture where cost awareness is baked into every engineering decision.
See Your Kubernetes Cost Breakdown in Minutes
How Does Kubernetes Cost Allocation Work?
Getting allocation right separates organizations that manage costs from those that merely report on them. In VM environments, allocation is simple: one server, one team. In Kubernetes, multiple workloads share nodes. Without purpose-built tools, nobody owns the bill.
Tagging vs Inference
Tag-based allocation uses Kubernetes labels. It is clean but breaks when tagging discipline is poor. Inference-based uses namespace patterns and usage ratios. Best platforms combine both. See our tagging strategies, cloud tagging best practices, and AWS tagging strategy.
Shared Cost Challenges
System pods serve all tenants but belong to no team. Proportional splitting, fixed allocation, or separate tracking. Our FinOps allocation guide covers these frameworks. The FOCUS standard is emerging as the multi-cloud data format.
What Are Kubernetes Unit Economics and Why Do They Matter?
If you only track total Kubernetes spend, you are managing costs at the wrong altitude. Unit economics gives you the granularity that drives real decisions: which customers are profitable, which services are too expensive, which deployments erode margin.
Cost per Workload
Combine node-level pricing with pod-level consumption. Track over time to reveal trends. Our FinOps KPIs guide identifies which metrics matter most. The 101 cloud financial management statistics collection adds industry context.
Cost per Customer
For SaaS companies, knowing the cost to serve each customer is a competitive advantage. Our CFO guide to cloud spend shows how executives use this data. Teams balancing growth and profitability should explore the Rule of 40.
How Do You Forecast Kubernetes Costs Accurately?
Why Forecasting Fails
We have seen forecasts miss by 25-40%. Burst scaling, new microservices, and commitment threshold crossings are the primary culprits. Our cloud cost forecasting guide provides a practical framework. For SaaS-specific planning, see best forecasting tools for SaaS.
The AI Unpredictability Factor
A single misconfigured HPA can consume an entire node pool in minutes. AI inference workloads add another dimension. Teams managing AI and GenAI workloads need specialized forecasting for GPU utilization and LLM cost dynamics. The hidden costs of AI token pricing are catching many teams off guard.
How Does Anomaly Detection Prevent Kubernetes Cost Overruns?
If your team only discovers cost anomalies at the end of the month, you are leaving $3K–$10K per incident on the table. On a $100K monthly K8s bill, catching an anomaly 24 hours earlier saves real money. Our AI cost optimization guide explains how AI-powered anomaly detection works in practice.
Which Kubernetes Cost Management Tools Should You Use?
| Capability | Native Cloud Tools | Open Source (Kubecost) | Dedicated (Opslyft) |
|---|---|---|---|
| Multi-cloud visibility | Single provider | Limited | Full AWS, Azure, GCP |
| Container allocation | Basic or absent | Namespace + pod | Container-level + shared cost splitting |
| AI/ML cost tracking | Limited | Not supported | Token + GPU tracking |
| Automated right-sizing | Basic suggestions | Recommendations only | AI-powered automation |
| Governance | Per-provider budgets | Basic alerts | Unified cross-cloud governance |
| Forecasting | Historical trending | Basic projections | ML-based workload-aware |
Most Kubernetes waste comes from overestimated CPU requests, not unused nodes. That distinction matters because it points to a fixable engineering habit, not a structural problem.
What Are the Biggest Kubernetes Cost Management Challenges?
Multi-cloud complexity fragments billing data. The State of FinOps 2026 shows the industry is moving beyond cloud-only into broader tech spend management.
The cultural shift is harder than the technical one. Gamifying FinOps accelerates adoption. Building a cost-conscious FinOps culture makes savings stick. Understand the 5 essential elements every FinOps team needs. For public sector, see FinOps in public sector. And ramp new team members with our container orchestration fundamentals.
Most Kubernetes waste comes from overestimated CPU requests, not unused nodes. That distinction matters because it points to a fixable engineering habit, not a structural problem.
What Do the Numbers Say About Kubernetes Costs?
| # | Statistic | What It Means for You |
|---|---|---|
| 1 | 40% average overprovisioning without visibility. | $200K waste on $500K annual spend. |
| 2 | Only 30% of orgs have mature K8s cost practices. | The majority still use spreadsheets. |
| 3 | 25-45% waste reduction within 6 months. | $250K-$450K recoverable on $1M bill. |
| 4 | AI/ML = 15-25% of cloud spend at scale. | GPU is the fastest-growing K8s cost category. |
| 5 | Requests exceed utilization by 2-4x. | Right-sizing alone cuts 20-35%. |
| 6 | 40% of container spend is untagged. | Invisible to optimization engines. |
| 7 | EKS = $876/cluster/year in mgmt fees alone. | 20+ clusters = $17K+ just in fees. |
| 8 | Spot reduces node costs 60-90%. | $100K bill -> $10K-$40K. |
| 9 | 85%+ K8s adoption in cloud-mature orgs. | Cost management is core FinOps. |
For deeper data: 101 FinOps statistics, 101 cloud computing statistics, 101 cloud financial management statistics.
