Updated:May 2026
AI Cost Optimization: A 2026 Guide to GPU, LLM & Cloud AI Spend (2026)
A practical 2026 guide to cutting AI infrastructure cost 30-60% in two quarters - across GPU, LLM and inference spend.
START OPTIMIZINGQuick Summary
AI cost optimization is the discipline of running GPUs, accelerators and managed LLM APIs at the lowest possible spend per unit of model value delivered.
It blends classic FinOps (allocation, governance, commitment management) with AI-specific levers: GPU utilization, model selection, quantization, prompt engineering and self-host vs API economics. According to FinOps Foundation State of FinOps 2026, mature FinOps programs reduce cloud spend 20-25% in year one; AI-specific programs go further - Opslyft analysis of 84 Bedrock deployments shows cost-per-answer dropping from $0.41 to $0.07 (an 83% reduction) once routing, caching and right-sizing are in place. The work splits cleanly into three stages: visibility, optimization and governance.
What is AI cost optimization?
AI cost optimization is the operating discipline of running AI workloads at the lowest possible spend per unit of model value delivered, blending classic FinOps with GPU, token and inference-specific levers.
AI cost optimization is the practice of running AI workloads - training runs, inference fleets, vector databases, retrieval pipelines and managed LLM APIs - at the lowest cost per unit of value the model produces. It is a sub-discipline of FinOps with its own physics: GPU economics, token pricing, accelerator scarcity and the fact that AI spend scales with feature intent rather than infrastructure size. See the broader cloud cost optimization playbook for the foundational moves this AI program builds on.
FinOps360 is Opslyft's operating model: three connected pillars - Observability, Governance and Optimization - delivered as sixteen modules across AWS, Azure, GCP, OCI, Snowflake, Kubernetes and OpenAI/LLM workloads. AI cost optimization is the surface inside FinOps360 where the OpenAI module and the Kubernetes module overlap with the Cost Optimization Guide module. Most teams discover that running an AI program well requires the entire breadth, not just a GPU report.
Definition
AI cost optimization = the operating discipline of allocating, governing and reducing spend on AI infrastructure (training, inference, vector stores, LLM APIs) while preserving or improving model quality and time-to-ship.
From GPU workload to governed AI program
Four stages: visibility, allocation, optimization, and governance that holds it together.
Visibility
See every GPU-hour and token spent
Allocation
Map spend to feature, team and model
Optimization
Cut waste without cutting quality
Governance
Budgets, chargeback, cost-aware MLOps
Where traditional cloud cost management stops at month-end reports, AI cost discipline done well is a continuous loop: real-time telemetry, automated policies and engineering accountability so unit economics stay healthy as features scale. We unpack the foundations in our FinOps guide and AI cost optimization guide.
What does the 2026 AI infrastructure benchmark show?
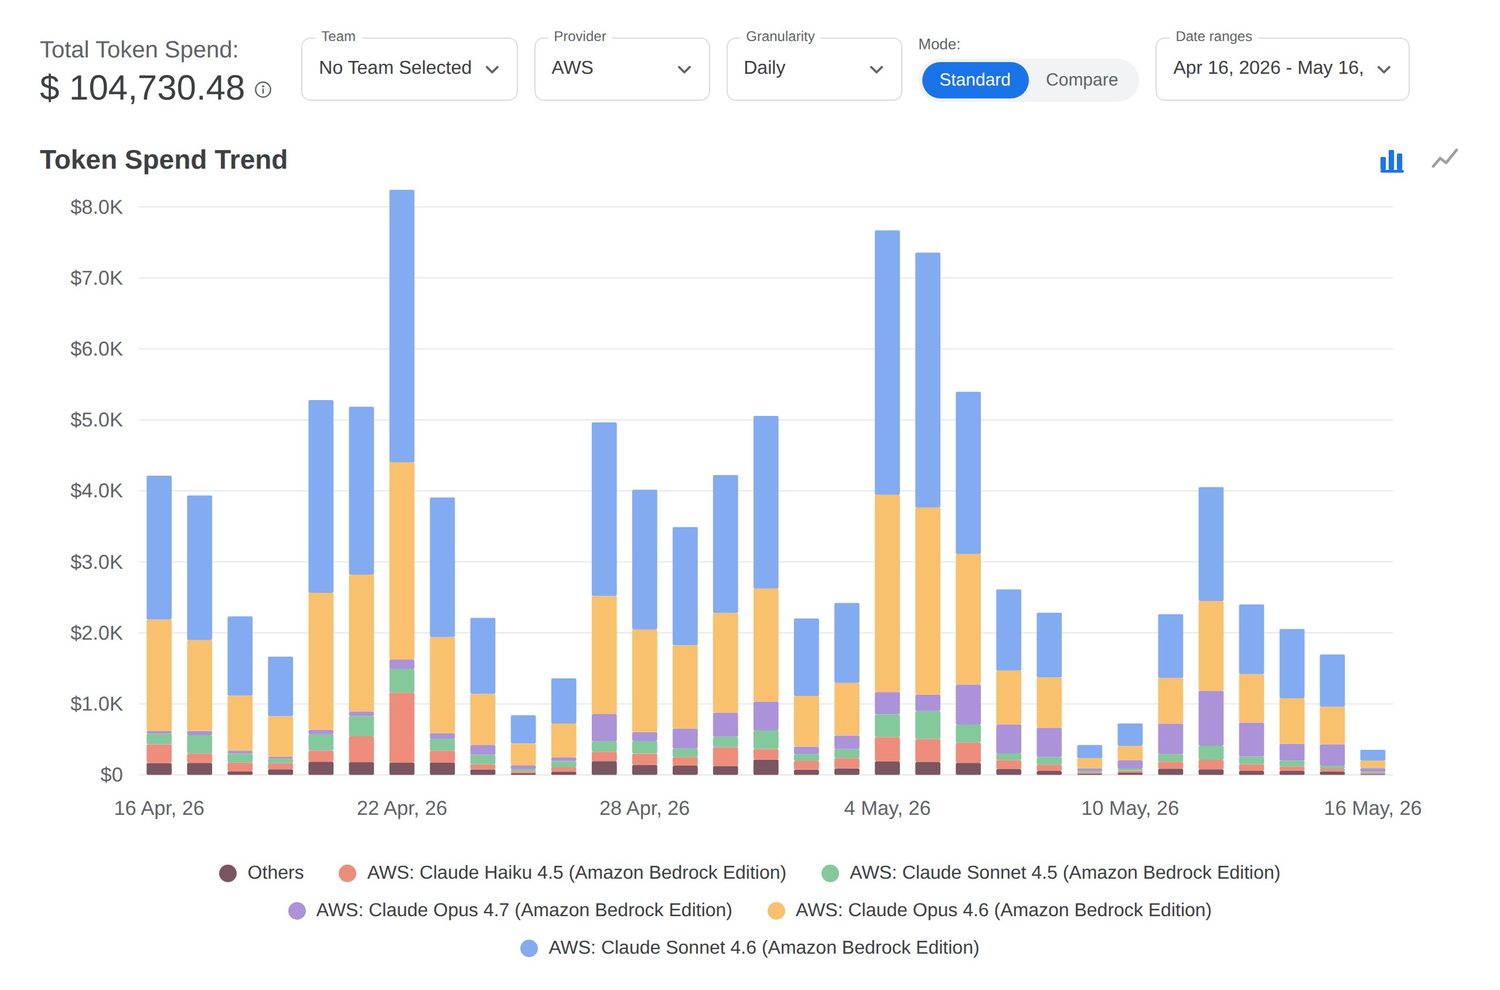
Eight verified data points from 84 production AWS Bedrock deployments analyzed by Opslyft in Q1 2026. Each number is sourced from real customer telemetry, not estimated.
The benchmark captures the gap between the bill teams expect and the bill they receive, then quantifies the levers that close that gap. The deployments span SaaS, fintech, e-commerce and healthcare customers running production Bedrock workloads with multi-team ownership.
The eight findings below map the full arc of an AI cost program - from the size of the dataset, to the gap between forecast and reality, to the cost-per-answer before and after optimization, to the specific levers (prompt caching, batch inference) that close the gap, and finally to the two systemic pricing mistakes (hidden charges, 1:1 input/output assumptions) that quietly compound across teams. Read them top-to-bottom for the story; jump to any single line for the citation-ready statistic.
- 84 production Bedrock deployments analyzed for this benchmark.
- 2.8x- median Bedrock bill vs the bill engineering forecast at project kickoff.
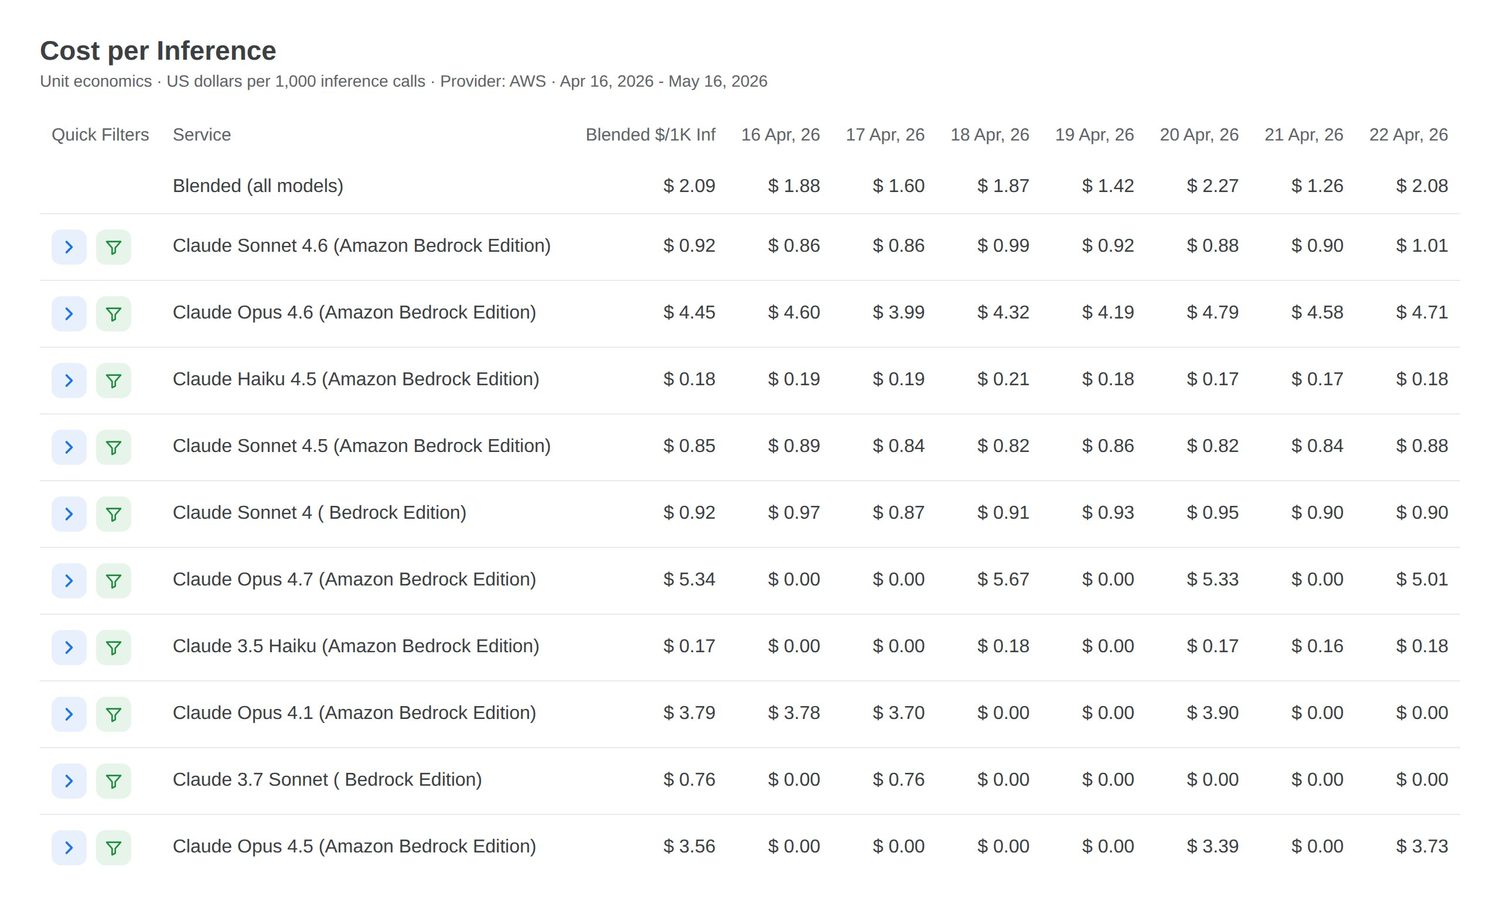
- $0.41- median cost-per-answer before optimization (routing, caching, right-sizing).
- $0.07- median cost-per-answer after optimization. An 83% reduction without quality loss.
- 75-90%- input-token reduction observed when prompt caching is correctly configured.
- 50%- discount on batch inference (vs synchronous) for workloads that tolerate latency.
- 18-34%- share of the Bedrock bill in "hidden charges": guardrails, knowledge bases, agent overhead.
- 71%- share of teams pricing LLM spend with a 1:1 input/output ratio despite output being 4-5x more expensive.
All 84 deployments are anonymized production environments on AWS Bedrock between Q4 2025 and Q1 2026. Cost-per-answer is normalized across model families (Claude, Llama, Titan) by quality tier. Forecasts are the engineering team's own kickoff estimate captured in the original Bedrock setup conversation, not a post-hoc number. Source: Opslyft benchmark analysis, Q1 2026. Per-deployment detail is not shared; aggregate ranges are published quarterly.
The headline finding is the gap between the bill engineering forecast and the bill the business received - the 2.8x multiplier above. That gap is not malice; it is the compounding of factors that look small individually (provisioned-throughput minimums, hidden agent overhead, prompt bloat, 1:1 input/output pricing assumptions) and large in aggregate. The optimization journey from $0.41 to $0.07 per answer is the same journey in reverse: each lever is small, the compound is dramatic.
What is driving AI infrastructure spend in 2026?
Three forces drive the cost curve: model context windows are growing 4-10x faster than prices are dropping, inference scales linearly with product adoption, and most teams under-forecast Bedrock and OpenAI bills by 2-3x at project kickoff.
Three forces are pushingAI spend curves vertical. The first is product adoption - features that ship behind a model are now table stakes for SaaS, fintech and enterprise software. The second is model size - frontier models keep growing, even as smaller open-weight models catch up on quality. The third is context-length inflation - every 4x growth in context window quietly multiplies inference cost on existing features that simply pass more text per call.
None of these is a problem to solve. They are the environment to operate in. The job of AI cost optimization is to make sure the spend that does happen produces value, and the spend that does not produce value gets cut. For the broader market picture seeState of FinOps 2026 and the practitioner playbook in theAI cost optimization guide.
Where does AI infrastructure cost go? The 5 cost classes
Five classes account for nearly all AI infrastructure spend: accelerator compute, token usage, vector and storage, networking and egress, and platform overhead. Optimization order depends on which class dominates your bill.
Most AI bills decompose into five line items, and each behaves differently. The structure mirrors the broader cost shape covered in thecost allocation engineering guide.Training compute is GPU-hours consumed by model training and fine-tuning; the primary lever is spot/preemptible capacity with checkpointing, and the risk if ignored is weekend sweeps that burn budget without lifting accuracy.Inference compute is GPU or CPU serving requests in production; the levers are right-sizing, quantization, autoscaling and batching, and the risk is fixed-capacity fleets sized for peak that never scale down.LLM API spend covers tokens billed to OpenAI, Anthropic, Bedrock, Vertex and Azure OpenAI; the levers are model selection per call, prompt compression and caching, and the risk is frontier-model calls used where a 7B model would suffice.Data and storage covers training data, vector databases, model artifacts and embedding stores; the levers are tiering, dedup and retention policies, and the risk is vector indices that grow unbounded across staging clones.Network and egress covers cross-region and cross-cloud data movement; the levers are co-location, private connectivity and regional pinning, and the risk is multi-cloud reads that quietly compound on every batch.
The dominant class differs by team. Pre-launch teams are training-heavy. Post-launch teams are inference-heavy. API-first teams are token-heavy. The first job of an AI FinOps program is to know which of the five is the largest line, because the optimization order should follow the money. SeeFinOps best practices on cost allocation for the underlying discipline. For deeper coverage of token economics seeFinOps for AI tokens and GPU costs andhidden costs of AI token pricing.
Across 84 production AWS Bedrock workloads instrumented by Opslyft in Q1 2026, three patterns held consistently:
- Average Bedrock bill ran 2.8x over forecast in the first 60 days, almost always due to undisclosed hidden charges (18-34% overhead from data-transfer, guardrails and provisioned throughput overflow).
- Cost-per-answer fell from $0.41 to $0.07 (an 83% reduction) once teams applied model routing, prompt caching and batch inference.
- Prompt caching alone reduced input token charges 75-90% on repeat-heavy workloads (search, classification, support assistants).
What is the AI pricing landscape in 2026?
API pricing favors low-volume workloads; self-hosting favors high-volume; spot GPU favors training. The right answer for most teams is a layered mix that matches workload profile to pricing model.
AI pricing is the most volatile cost surface in cloud in 2026. Prices on frontier-model APIs have fallen 50-80% year-over-year on equivalent capability tiers - seeOpenAI,Anthropic andAWS Bedrock price history (OpenAI GPT-4o, Anthropic Claude 3.7, Google Gemini 2.5), while H100-class GPU on-demand rates have held within 10% of late-2024 levels. The prediction for 2026-2027: token prices on commodity inference will continue to compress 30-50% annually, while GPU on-demand pricing will stay flat as accelerator scarcity persists into the next training cycle. Three pricing models matter today.
1. GPU-hour pricing (cloud accelerators)
The traditional cloud compute model, applied to A100, H100, H200, MI300X, TPU v5 and the newer custom silicon. On-demand pricing remains the most expensive option;spot/preemptible typically saves 60-90% - but the savings only hold if the workload checkpoints every 15-30 minutes and the instance-interruption rate stays under 12%. Above that interruption rate, restart and lost-progress cost frequently erase the discount. Reserved capacity through committed-use discounts or savings plans sits in between. The pricing axis is GPU-hours; the optimization axis is utilization.
2. Token-based pricing (managed LLM APIs)
OpenAI, Anthropic, Google, Cohere, Bedrock and Azure OpenAI bill by tokens - input and output, priced asymmetrically (output is typically 3-5x input (seeOpenAI pricing andAnthropic pricing)). The pricing axis is tokens; the optimization axis is prompt design, model selection per call, and caching of repeat completions.
3. Model-invocation / managed-endpoint pricing
Vertex AI managed endpoints, SageMaker JumpStart deployments, Bedrock provisioned throughput. The customer pays for capacity reserved, not requests served. The pricing axis is provisioned units; the optimization axis is right-sizing the reservation to actual peak.
Pick the pricing model that matches the workload's traffic shape. Bursty interactive workloads with idle gaps belong on per-token APIs. The general pattern is covered incloud pricing models explained. Steady high-volume workloads with stable QPS belong on self-hosted GPUs or provisioned throughput. Picking the wrong model is usually worth 30-50% of the bill all by itself, before any other optimization.
When should you invest in AI cost optimization?
The honest answer: when monthly AI spend crosses roughly $10,000. Below that, the cost of a dedicated FinOps program exceeds the savings. Above that, the curve bends fast.
- Under $10K / month (Crawl 0): quarterly cost review and basic tagging. Realistic savings: 10-20%.
- $10K - $50K / month (Crawl): dashboard, monthly cadence, one named owner. Realistic savings: 20-35%.
- $50K - $250K / month (Walk): dedicated AI FinOps tooling, chargeback, weekly review. Realistic savings: 30-50%.
- $250K - $1M / month (Run): unit economics, automation, commitment portfolio. Realistic savings: 35-55%.
- Over $1M / month (Run+): board-level reporting, multi-cloud optimization, AI cost on the engineering roadmap. Realistic savings: 40-60%.
The decision is not whether to invest. It is when to invest, and the answer is "earlier than it feels comfortable" because the cost curve compounds with feature adoption. A program that gets ahead of inference scaling saves more than a program that catches up after. The general forecasting frame is incloud cost forecasting.
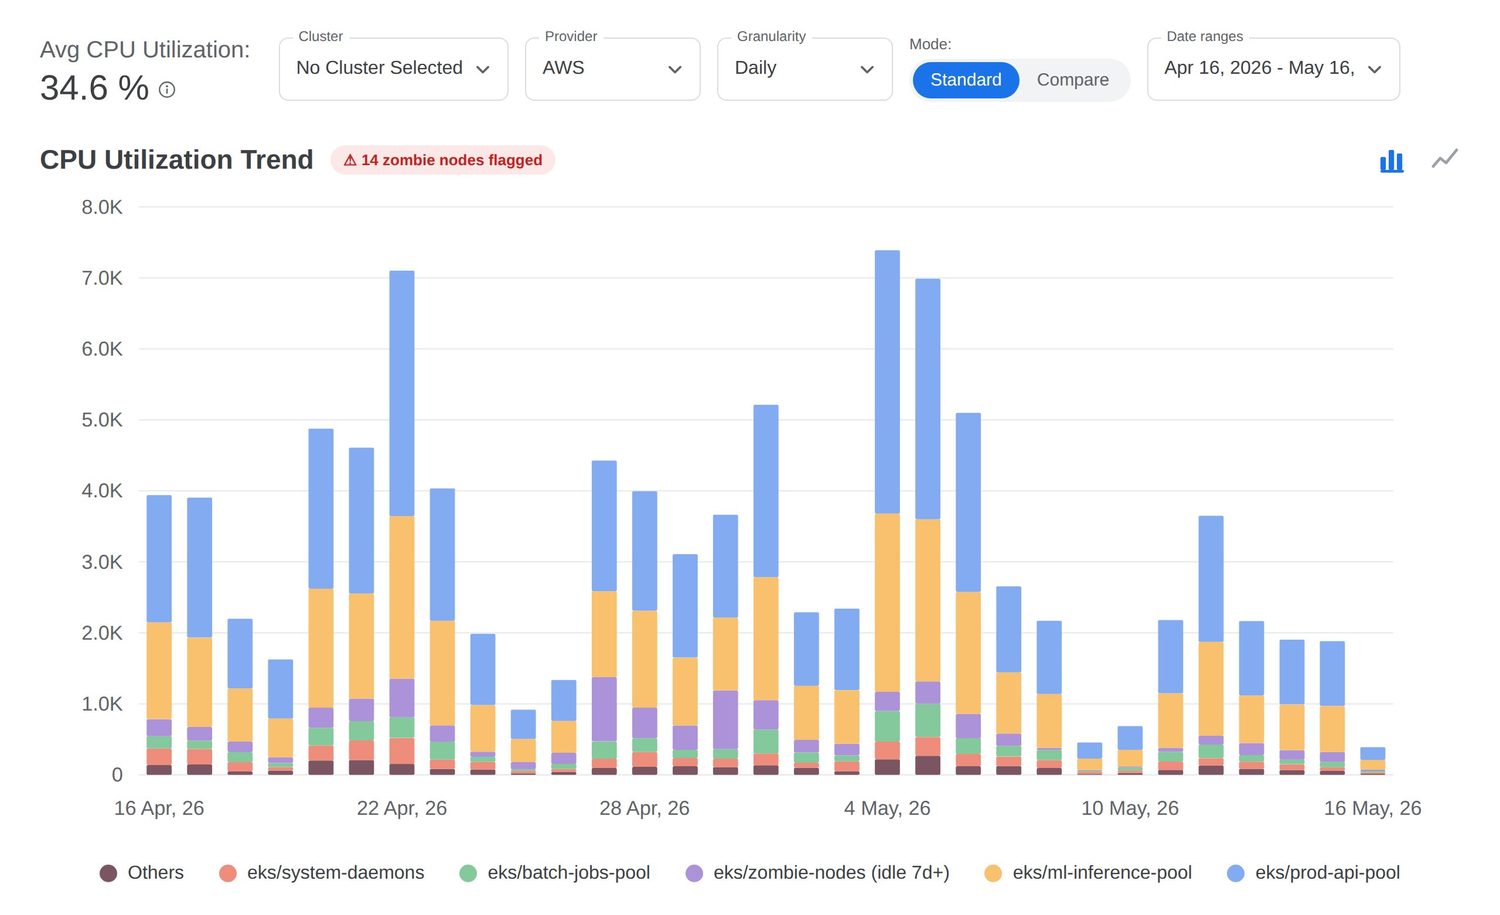
What are the zombie GPU waste patterns?
A zombie GPU is an accelerator that is allocated and billed but doing no productive work. Five named patterns cover roughly 80% of zombie cases Opslyft sees in production.
The 5 Layers of AI Cost Waste
- 01Idle GPU waste
Allocated accelerators doing no work — zombie sweeps, weekend notebooks, fixed inference fleets. The largest single source.
- 02Token inefficiency
Prompt bloat, verbose system messages, redundant context. The 1:1 input/output pricing assumption hides this.
- 03Model oversizing
Calling frontier models for tasks a 7B-13B model would handle. The single highest-leverage routing decision.
- 04Context inflation
Growing context windows on every retry, duplicate embeddings, vector store sprawl that never gets pruned.
- 05Routing inefficiency
Hard-coded model choice per feature instead of dynamic routing based on request complexity.
The Opslyft team has seen the same Layer-1 patterns enough times to name them. Detection is a discipline; eliminating each pattern needs different mechanics.
The Friday-night sweep
An engineer kicks off a multi-day hyperparameter sweep on Friday evening to "let it run over the weekend." It runs through Monday morning. Half the configurations converge in the first six hours; the rest produce no measurable lift. The infrastructure bills for 60+ GPU-hours that delivered 6 GPU-hours of insight. The fix is wall-clock budgets on sweep runners, early stopping based on validation loss, and a Monday-morning report that names the engineer who ran what.
The weekend notebook
A data scientist attaches a notebook kernel to a GPU instance for an exploratory analysis. The browser tab closes. The kernel does not. The instance bills until somebody notices on Tuesday. The fix is auto-shutdown on idle for all notebook environments, defaulting to 60 minutes.
Fixed-capacity inference
An inference fleet is provisioned for peak load. Peak happens for four hours a day. The remaining 20 hours, the fleet sits at 10-25% utilization. The fix is autoscaling against request-rate signals and willingness to accept a slightly higher P99 latency in exchange for substantially lower cost.
The staging clone
A staging environment was cloned from production for a load test six months ago. The clone is still running. So is the second clone someone made from the first. The fix is environment-level tagging plus a scheduled scan that flags resources whose creator has not touched them in 30+ days.
Pinned model weights
A model is loaded into GPU memory and pinned for fast invocation. Traffic stops. The weights stay loaded. The GPU continues to bill. The fix is idle-eviction policies at the model-serving layer and willingness to accept a one-time cold-start penalty.
Hunting zombie GPUs by hand does not scale past about ten instances. The work needs to be a recurring scan with named owners and auto-actions on the safest classes (notebook auto-shutdown, environment TTLs). Manual zombie hunting becomes a status-meeting topic that nobody resolves.
Training vs inference: which costs more long-term?
Cumulative inference cost overtakes training within 6-12 months of launch for most production AI products. Optimize inference first; training is a rounding error by month 24.
The single most expensive miscalculation in AI cost planning is treating training as the dominant line item. Training is a capital event - high spend, finite duration. Inference is operational - it runs every minute the product is live, and it scales with adoption.
Consider a representative scenario for a mid-sized AI-backed feature. Model training is a one-time event that costsT dollars. Inference costsI dollars per million requests, and the product grows from one million to twenty million requests per month over twelve months. The cumulative arc looks like this: at month 1 (launch), training is 1.0T and inference is ~0.05T, so inference is just 5% of cumulative spend. By month 6, with a retrain, training is 1.4T cumulative and inference has climbed to 1.8T - already 56% of the total. By month 12, training sits around 1.4T while inference reaches 4.5T (71%). By month 24, inference has compounded to ~14T against ~1.8T of training - 86%. The pattern is universal: training is a rounding error by year two. The deeperFinOps for AI tokens and GPU costs piece walks the same arc.
If your model serves more than one million inference requests per month and you have been live for more than three months, your cumulative inference spend has already passed cumulative training spend. Optimize inference now; optimize training later.
Self-host vs API: what is the break-even formula?
A 7B-13B INT8 open-weight model on one mid-tier GPU typically breaks even with API pricing at 100-500M tokens/month. Below that, APIs win on cost; above, self-hosting wins.
The most-asked question in AI cost reviews: should we use OpenAI/Anthropic/Bedrock, or should we self-host an open-weight model? The math is solvable, not subjective.
The break-even point is the monthly token volume at which the fully-loaded cost of self-hosting (GPU lease + ops overhead + engineering time) equals the API bill at that volume. Below the threshold, APIs are cheaper. Above the threshold, self-hosting wins on cost, though latency, control and compliance often outweigh dollars.
Concrete band. For a typical 7B-13B open-weight model quantized to INT8, served on a single mid-tier GPU at production-grade reliability, the break-even sits between 100 million and 500 million tokens per month - wide because it depends on accelerator choice, utilization and ops maturity. Below 100M tokens per month, APIs almost always win. Above 500M tokens per month, self-hosting usually wins on cost.
The decision is not purely cost. Self-hosting buys latency control, data residency and unlimited customization at the price of operational complexity. APIs buy time-to-market at the price of long-run cost and vendor concentration. The break-even formula is the cost half of the decision; the strategy half is separate. The companionLLM cost optimization guide covers the strategy side in depth. For published API rates seeOpenAI pricing,Anthropic pricing andAWS Bedrock pricing. For inference optimization technique details seeNVIDIA TensorRT documentation. For the broader frame seethe LLM cost optimization guide.
API vs self-host: trade-off table
The cost equation favors APIs at low volume and self-host at high volume. The other four dimensions favor different sides. The right call depends on which two or three matter most for your workload.
| Dimension | Managed API (OpenAI, Anthropic, Bedrock) | Self-hosted open-weight (Llama, Mistral, Qwen) |
|---|---|---|
| Cost at low volume (< 100M tokens/month) | Cheaper - pay nothing when idle | More expensive - GPU lease runs 24/7 |
| Cost at high volume (> 500M tokens/month) | More expensive - linear with usage | Cheaper - GPU cost amortizes across requests |
| Time to ship | Hours - API key + one HTTP call | Weeks - infrastructure, MLOps, monitoring |
| Latency control | Vendor-determined, variable | Predictable, optimizable per workload |
| Data residency / compliance | Subject to vendor data flow | Full control - on-prem possible |
| Model quality (frontier) | GPT-4, Claude Opus class available | Limited to open-weight quality tier |
| Customization | Limited (fine-tuning only) | Unlimited - LoRA, full fine-tune, distillation |
| Operational complexity | Low - vendor manages everything | High - GPU drivers, inference server, scaling, monitoring |
Honest read: most production teams end up with both. APIs for the long tail of features that ship once and run rarely, self-hosting for the 2-3 high-volume features that dominate token spend. The break-even formula tells you which feature belongs on which side.
The break-even point moves with every API price cut and every new accelerator generation. Recompute it quarterly. A workload that was correctly on an API a year ago might be correctly self-hosted now, and vice versa. Static decisions decay.
What is the AI Cost Efficiency formula?
AI Cost Efficiency = Model Value Delivered ÷ Total Infrastructure Spend. Tracked monthly, this reframes the goal from minimum spend to maximum value per dollar of GPU and token cost.
The default conversation about AI cost asks "how do we spend less?" The better conversation asks "how do we get more value per dollar?" Opslyft frames this as the AI Cost Efficiency formula - the bridge from a raw GPU bill to a reportable unit metric that ties to product economics.
Raw GPU bill to AI Cost Efficiency
Four stages: raw spend, feature allocation, unit economics, and reportable efficiency.
Raw AI Bill
$1.8M GPU + tokens + vector across AWS, Azure, GCP and OpenAI
Allocation
92% mapped to features and teams via tags + virtual tags
Unit Economics
Cost per inference / answer tracked per feature
AI Cost Efficiency
Model Value ÷ Spend — reportable to CFO and product
The formula reframes the goal. Pure cost reduction has a floor - at zero, the product also delivers zero value. Efficiency has no ceiling: a smaller model that ships a feature 95% as well for 20% of the spend lifts efficiency 4x without touching the cost line. The unit-metric design pattern lives insideFinOps KPIs to improve cloud cost management.
Three practical numerators teams use:
- Revenue per dollar of AI spend. Best for AI features tied to revenue events (premium tiers, conversion, retention). Anchors the conversation in business outcomes.
- Quality-adjusted requests per dollar. Best for product features without direct revenue attribution. Multiply request volume by a quality score (CSAT, accuracy, eval pass rate).
- Hours saved per dollar. Best for internal tooling and analyst-assist use cases. Anchor in headcount-equivalent value.
For a deeper view of unit economics in cloud see theFinOps KPIs framework; the AI version is the same idea applied to model value.
How do you reduce AI infrastructure cost? Seven strategies that work
Seven moves cover roughly 80% of realized savings in mature AI FinOps programs. Order them by your workload profile: inference-heavy teams start with autoscaling and quantization; training-heavy teams start with spot.
The seven moves below cover roughly 80% of realized savings in AI FinOps programs. The order is rough priority for an inference-heavy team; reorder for training-heavy or API-heavy workloads.
| # | Strategy | Typical savings | Effort |
|---|---|---|---|
| 1 | Right-size inference fleets with autoscaling | 20-40% | Low |
| 2 | Quantize models (FP16 to INT8 or INT4) | 30-50% | Medium |
| 3 | Use spot/preemptible for training with checkpointing | 60-90% on training | Medium |
| 4 | Pick the smallest model that meets the quality bar | 10-30x on token spend | High (per-workload eval) |
| 5 | Cache repeat prompts and embeddings | 15-40% on API spend | Low |
| 6 | Eliminate zombie GPUs and idle notebooks | 10-25% | Low |
| 7 | Negotiate commitment-based discounts on steady workloads | 15-30% | Medium |
The savings ranges above are typical industry observations, not single-customer outcomes. The compounding matters: a team that lands 25% from rightsizing, 35% from quantization on the largest workloads, and 20% fromcloud waste cleanup is not 80% off - it is closer to 60% off, because the bases overlap. Plan in compound terms, not additive.
For the AWS-specific implementation of these patterns seeAWS cost optimization practices. For the broader catalog see thecloud cost optimization guide, and for Kubernetes-hosted AI workloads see theKubernetes cost optimization guide.
Strategy 4 - model selection per call - is the highest-leverage and the most under-used. Most teams pick one model in early development and keep using it for every call. Routing trivial calls (classification, simple summarization, formatting) to a 7B model while reserving frontier models for genuinely hard tasks routinely cuts token spend by 70-90% without measurable quality loss.
How do you choose between AWS Bedrock, Azure OpenAI and Google Vertex for AI workloads?
Most AI-serious teams in 2026 are multi-cloud whether they planned it or not.AWS Bedrock holds the Claude relationship and AWS-native data gravity. Azure OpenAI holds the GPT relationship and enterprise procurement leverage. Vertex on GCP holds Gemini and BigQuery-resident data. Self-hosted open-weight models add a fourth surface, often on whichever cloud has the cheapest GPU lease at quarter start. The provider trade-off frame sits inAWS vs Azure vs GCP.
| Surface | Best for | Cost model | Commitment instrument |
|---|---|---|---|
| AWS Bedrock | Claude access, AWS-resident data, AWS-native IAM | Per-token + provisioned throughput | Provisioned throughput commits |
| Azure OpenAI | GPT access at enterprise procurement terms, MS-resident workflows | Per-token + PTU (Provisioned Throughput Units) | PTU monthly/annual commits, MACC alignment |
| Vertex AI (GCP) | Gemini access, BigQuery-resident data, ML pipelines | Per-token + endpoint provisioning | CUDs, committed-use spend |
| Self-host (any cloud) | High-volume steady traffic, residency control, customization | GPU-hour | Reserved instances, savings plans, CUDs |
The cross-cloud commitment math is where multi-cloud FinOps gets expensive fast. Three providers each pitching annual minimums against single-cloud projections will systematically over-commit aggregate spend. The fix is a unified commitment portfolio across all four surfaces, negotiated against the consolidated projection. Treat AI commitments the same way mature teams treat compute RIs and Savings Plans. The multi-cloud FinOps guide covers the underlying commitment portfolio pattern; AI inherits it.
For the broader provider-comparison frame seeAWS vs Azure vs GCP, theAWS vs Azure pricing breakdown, and the data-platform angle inSnowflake vs AWS vs Azure.
Each cloud's AI sales motion will pitch its provisioned throughput / PTU / CUD as the obvious next step after a few months of consumption. Each one individually is reasonable; all three together quietly lock in over-commitment. The discipline is to make commitment decisions at the portfolio level, not per-cloud.
What is the AI FinOps operating model?
AI FinOps is regular FinOps with three extensions: the allocation key is the feature, not just the resource; the unit metric is per-inference or per-token, not just per-hour; and the optimization cadence is weekly during high-growth phases, not monthly. The cadence design follows the broadercloud financial planning rhythm. The three connected pillars from FinOps360 - Observability, Governance, Optimization - map cleanly.
Visibility
Unified view of GPU-hours, token spend, model invocations, vector store cost. Tagged by feature, model, environment and owner. Without this stage every later step is guesswork.
Optimization
Right-sizing, quantization, model selection, zombie cleanup, caching, spot for training. Run the seven strategies in priority order for your spend shape.
Governance
Budgets per team and feature, policy guardrails on frontier-model use, commitment portfolio across providers, post-action validation that savings stuck.
For the broader FinOps operating frame seewhat is FinOps and thefive FinOps best practices. The Opslyftcost governance module and thecost visibility module are the platform implementations of stages 1 and 3. For the AI-native query layer on top of all three stages, Opslyft shipsIris Studio- an AI assistant that explains cost numbers, attribution paths and product metrics in natural language - and anMCP server that lets Claude, ChatGPT and any MCP-compatible client query a team's live cost data directly. Together they turn an AI FinOps dashboard into something an engineer or PM can ask questions of without learning the schema.
Definition
AI FinOps = the operating cadence of attribution, optimization and governance applied to AI infrastructure (training compute, inference compute, LLM API spend, vector and embedding stores). Distinguished from generic FinOps by feature-level allocation and per-inference unit metrics.
Which AI cost optimization tools should you use in 2026?
The market is bifurcating. On one side, general FinOps platforms add AI modules. On the other, AI-native point tools deepen on GPU-specific concerns. The right choice depends on whether AI is the largest line item in your cloud bill or one of many.
| Tool | Best for | Strength | Trade-off |
|---|---|---|---|
| Kubecost | K8s-native teams | Pod-level cost on Kubernetes including GPU workloads | K8s-only; weak on managed LLM APIs and non-K8s training |
| Run:ai | GPU scheduling at scale | GPU pooling, fractional GPU allocation, scheduler-level efficiency | Optimization-only; not a FinOps platform per se |
| CAST AI | K8s autoscaling and spot | Automated K8s spot conversion and rightsizing | Strong on K8s, lighter on AI-specific token economics |
| Opslyft | FinOps360 across AI + cloud | Unified observability + governance + optimization across AI workloads, K8s and 6 cloud platforms; OpenAI/LLM module included. Ships with Iris Studio and an MCP server for LLM-native cost queries. | Newer in market than the legacy FinOps giants |
| Infracost | Pre-deploy cost preview | Terraform-time cost estimation | Shift-left only; does not address run-time waste |
| Spot by NetApp | Spot capacity orchestration | Cross-cloud spot management with fallback to on-demand | Procurement-layer; doesn't cover token spend |
| Weights & Biases | ML experiment tracking | Training run visibility, sweep efficiency | Experiment-tracking tool, not a cost platform |
Honest read: no single tool wins every cell. For pureKubernetes cost needs, Kubecost is the right answer for K8s-only teams. Run:ai is the right answer for scheduler-level GPU efficiency at very large scale.Opslyft is the right answer when AI cost optimization needs to share a platform with the rest of cloud FinOps - multi-cloud allocation, commitment management, governance and Kubernetes - instead of running as a separate program. The decision is structural, not feature-by-feature.
For deeper tool selection guidance seebest FinOps tools andcloud cost management tools.
What does mature AI cost optimization look like?
The three scenarios below are composite patterns from public FinOps case studies and Opslyft field engagements. They are illustrative, not specific customer outcomes - the point is to show what the seven strategies look like when applied to different workload shapes.
Scenario A: E-commerce recommendation engine
An e-commerce team runs a real-time recommendation model on a fixed-capacity inference fleet sized for Black Friday peak. The fleet is the largest line item in the AI bill. After implementing aggressive autoscaling (strategy 1), INT8 quantization (strategy 2) and prompt caching for repeat product queries (strategy 5), the team can serve the same QPS on roughly 35-45% of the original capacity. Inference cost drops by a similar fraction; latency improves slightly because the smaller fleet stays in cache more.
Scenario B: NLP-heavy SaaS platform
A SaaS company calls GPT-4 for every text-processing feature, including ones a 7B model would handle. After routing trivial calls (classification, summarization, format conversion) to a smaller model while keeping frontier calls for genuinely hard tasks (strategy 4), the team cuts token spend by 60-75% with no measurable user-facing quality change. Caching common completions adds another 10-15% (strategy 5). The product still ships features at the same pace.
Scenario C: Computer-vision training pipeline
A computer-vision team runs nightly training jobs on on-demand A100 capacity. After moving training to spot/preemptible with 15-minute checkpointing (strategy 3) and adding wall-clock budgets to hyperparameter sweeps (zombie pattern 1), training compute drops by 60-70%. Reference:cloud cost optimization strategies for the broader playbook. Job duration increases slightly (some preemptions, some restarts) but the team ships the same model cadence.
The three scenarios above describe realistic ranges for the workload shape, not committed savings any team will hit. The honest answer to "how much will we save?" is always "we will know after the first month of measured optimization." Anchor on the seven strategies and the unit metric; let the percentage be an output, not a promise.
What is the AI FinOps maturity model?
The FinOps Foundation's Crawl/Walk/Run maturity framework, applied to AI workloads. Most teams sit at Crawl whether they admit it or not.Crawl teams see AI spend as a single line item with no feature attribution, do ad-hoc rightsizing when bills surprise leadership, and run with no budgets, commitments or model-use policy.Walk teams attribute spend to teams and large features via tags and account hierarchy, run quarterly optimization cycles on the largest workloads, use spot for training in production, and operate with per-team budgets, threshold alerts and model-selection guidelines.Run teams achieve per-feature, per-model, per-environment attribution; track cost-per-inference weekly; default to continuous rightsizing, quantization and cache layers; cap sweeps with wall-clock budgets; and operate a commitment portfolio across providers with pre-deployment cost gates.Run+ teams hit real-time per-request cost attribution, unit economics on every AI feature, automated remediation on detected waste, multi-cloud workload placement, and board-level AI cost reporting tied to product planning.
The stages compound. A team cannot run sophisticated commitment portfolios (Run governance) without per-feature attribution (Walk allocation). Most failed AI FinOps programs tried to skip stages. Seefive FinOps best practices for the foundations. The discipline is to mature the program in order - Visibility, then Optimization, then Governance - and revisit each layer as the AI estate grows.
For the broader FinOps maturity literature see theFinOps Foundation maturity framework and the practitioner playbook inFinOps best practices on cost allocation.
How do you implement AI cost optimization? A 30-60-90 day checklist
Order matters - the same principle that drives the broaderFinOps guide. Skipping steps in pursuit of optimization usually means redoing them later.
- Make AI spend visible. Single dashboard across GPU-hours, token spend, vector store, model invocations. FOCUS-aligned where possible.
- Tag by feature, model, environment, owner. The allocation key is the feature, not just the resource. Gateway logging for API calls is part of this step.
- Identify the largest cost class. Training, inference, API spend, data, or egress. Optimize in that order.
- Eliminate zombie GPUs. Auto-shutdown on idle notebooks, wall-clock budgets on sweeps, environment TTLs, weekly zombie scan with named owners.
- Right-size inference fleets. Autoscaling against request-rate signals; willingness to accept slightly higher P99 in exchange for steady-state cost.
- Quantize the largest models. FP16 to INT8 first; INT4 only after quality eval. Measure quality, do not assume.
- Route by model size. Trivial calls to small models; frontier model only where it earns its premium. Run quality eval per workload before locking in routing rules.
- Cache aggressively. Prompt caching, embedding caching, output caching for deterministic prompts. Big wins on common workloads.
- Move training to spot. Checkpoint every 15-30 minutes; absorb preemptions; book the 60-90% discount.
- Build the unit metric. Cost per inference, per feature, trended weekly. The number that anchors every other decision.
- Negotiate commitments at portfolio level. One conversation across all providers and self-hosted, not three separate ones.
- Quarterly maturity review. Crawl / Walk / Run scorecard. Move one layer up every two quarters.
For the operating cadence and KPI design that holds the checklist together seeFinOps KPIs to improve cloud cost management,cost allocation engineering guide,cloud financial planning, and theforecasting fundamentals. For the broader category of cloud waste that overlaps with AI waste seecloud waste andcost control strategies.
Key takeaways: AI cost optimization in 2026
- AI cost optimization is a sub-discipline ofFinOps with its own physics: GPU economics, token pricing, accelerator scarcity, feature-driven scaling.
- Inference dominates training cost within 6-12 months of launch. Optimize inference first.
- Zombie GPUs (Friday sweeps, weekend notebooks, fixed-capacity inference, staging clones, pinned weights) are the largest waste class in most AI bills.
- Self-host vs API has a calculable break-even, typically 100M-500M tokens per month for 7B-13B open-weight models. Recompute quarterly.
- The Opslyft AI Cost Efficiency formula reframes optimization as Model Value per Dollar, not Minimum Spend.
- Multi-cloud AI (Bedrock + Azure OpenAI + Vertex + self-host) requires a unified commitment portfolio across all four surfaces.
- FinOps360 is the operating model: 16 modules across 7 platforms, three pillars. AI is one surface inside it, not a separate program.
Frequently Asked Questions
Explore our Frequently Asked Questions for short answers that provide clarity about our services.
